How to Measure Customer Satisfaction Beyond NPS Scores: A Comprehensive Guide

How to measure customer satisfaction properly: which metrics to use, how to calculate CSAT, NPS and CES, where to place them, and how to act on the results.
Most businesses measure customer satisfaction the way they weigh themselves after a holiday: rarely, reluctantly, and with no plan for what to do about the number. They send an annual survey, look at the average, and file it. That isn't measurement — it's reassurance.
Measuring customer satisfaction properly means choosing metrics that answer a specific question, placing them where the customer actually feels something, and wiring the results into a decision someone owns. This guide covers how to do that: which metrics exist, what each one is genuinely for, how to calculate them, and how to build a programme that survives contact with a busy team.
Start with the question, not the metric
The most common mistake is choosing a metric first and reverse-engineering a reason for it. Teams adopt NPS because a board member mentioned it, then discover it tells them nothing about why last month's support queue was miserable.
Work the other way. Write down the question you actually need answered, then choose the measurement that answers it:
- "Would our customers recommend us?" — a relationship metric, measured periodically.
- "Did that specific interaction go well?" — a transactional metric, measured immediately after.
- "Is this process harder than it should be?" — an effort metric, measured at the point of friction.
- "Are customers staying and spending?" — behavioural data, which you already have and don't need to ask for.
Four different questions, four different instruments. Sending one survey and hoping it covers all four is why so much satisfaction data goes unused.
The core customer satisfaction metrics
Three survey-based scores do most of the work in practice. Each has a different question, a different scale, and a different job.
| Metric | What it asks | Best used for | When to send it |
|---|---|---|---|
| CSAT Customer Satisfaction Score | How satisfied were you with [this specific thing]? | Judging one interaction, product or delivery | Immediately after the interaction |
| NPS Net Promoter Score | How likely are you to recommend us to a friend or colleague? | Tracking the overall relationship over time | Quarterly, or at a relationship milestone |
| CES Customer Effort Score | How much effort did you have to put in to get this resolved? | Finding friction in a process | Right after a task, return or support ticket |
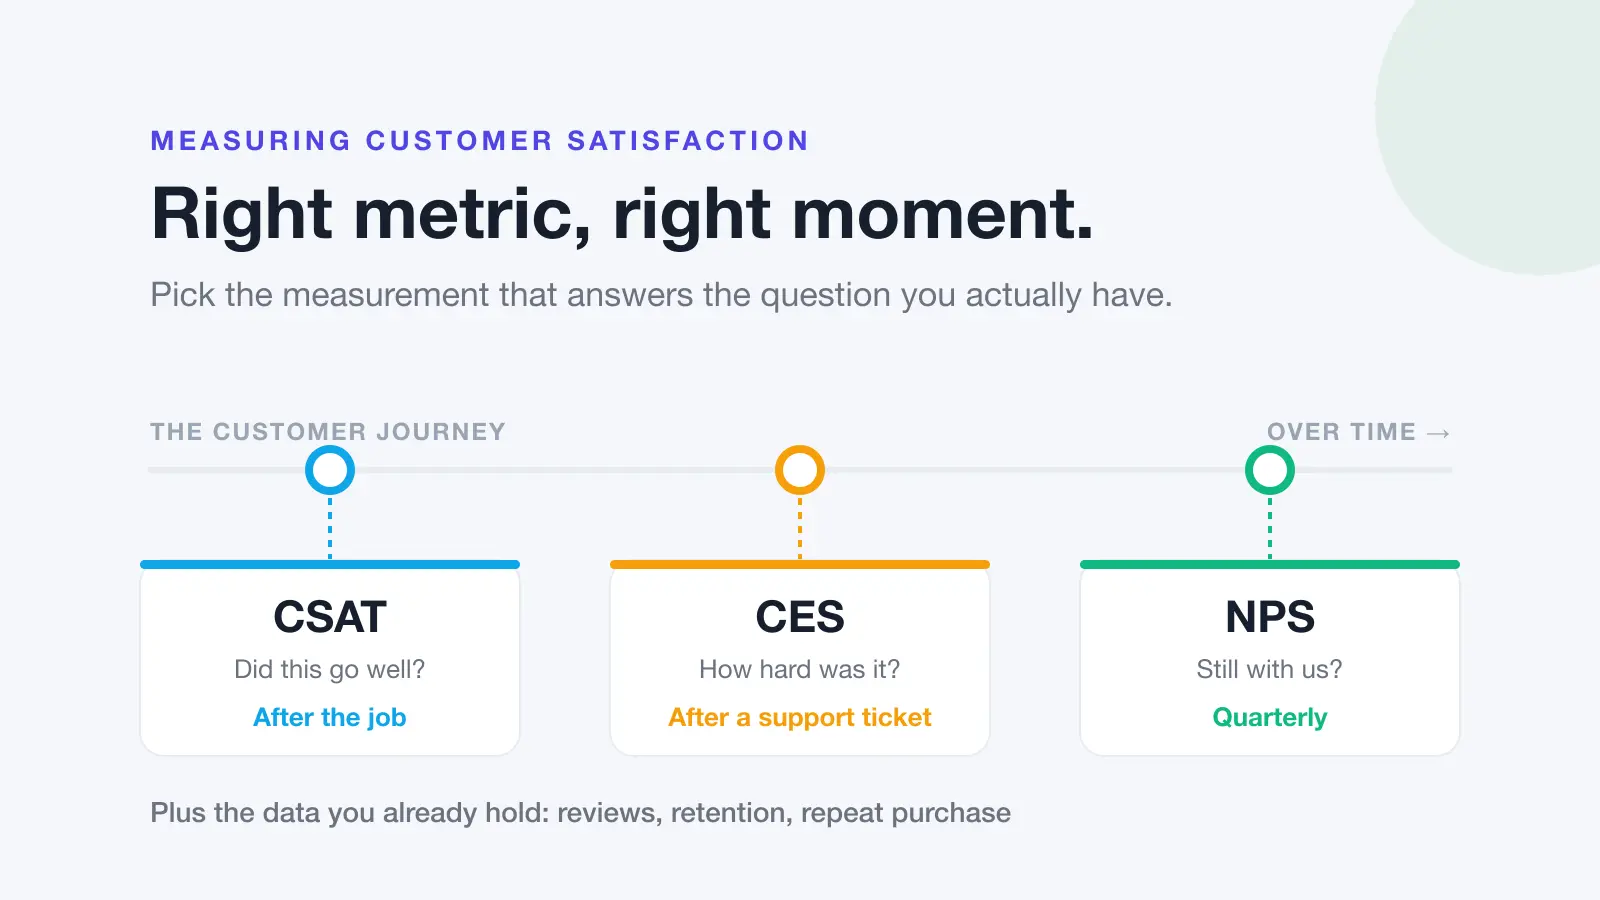
If you're deciding between them rather than building a full programme, we've compared them head-to-head in NPS vs CSAT vs CES. The short version: CSAT for interactions, CES for processes, NPS for the relationship.
How to calculate CSAT
CSAT is the simplest of the three. Ask customers to rate their satisfaction, usually on a 1-5 scale, then treat the top two ratings as satisfied:
CSAT % = (number of responses of 4 or 5 ÷ total responses) × 100
So 82 responses of 4 or 5 out of 100 gives you a CSAT of 82%. The score is a percentage, not a raw average — reporting a "CSAT of 4.1" is a different measurement and can't be compared with anyone else's CSAT.
The scale you choose matters more than people expect. A 1-5 scale and a 1-7 scale produce different percentages from identical customers, so pick one and never change it mid-programme. If you must change it, treat the switch as a hard break in your trend line and say so in the report.
How to calculate NPS
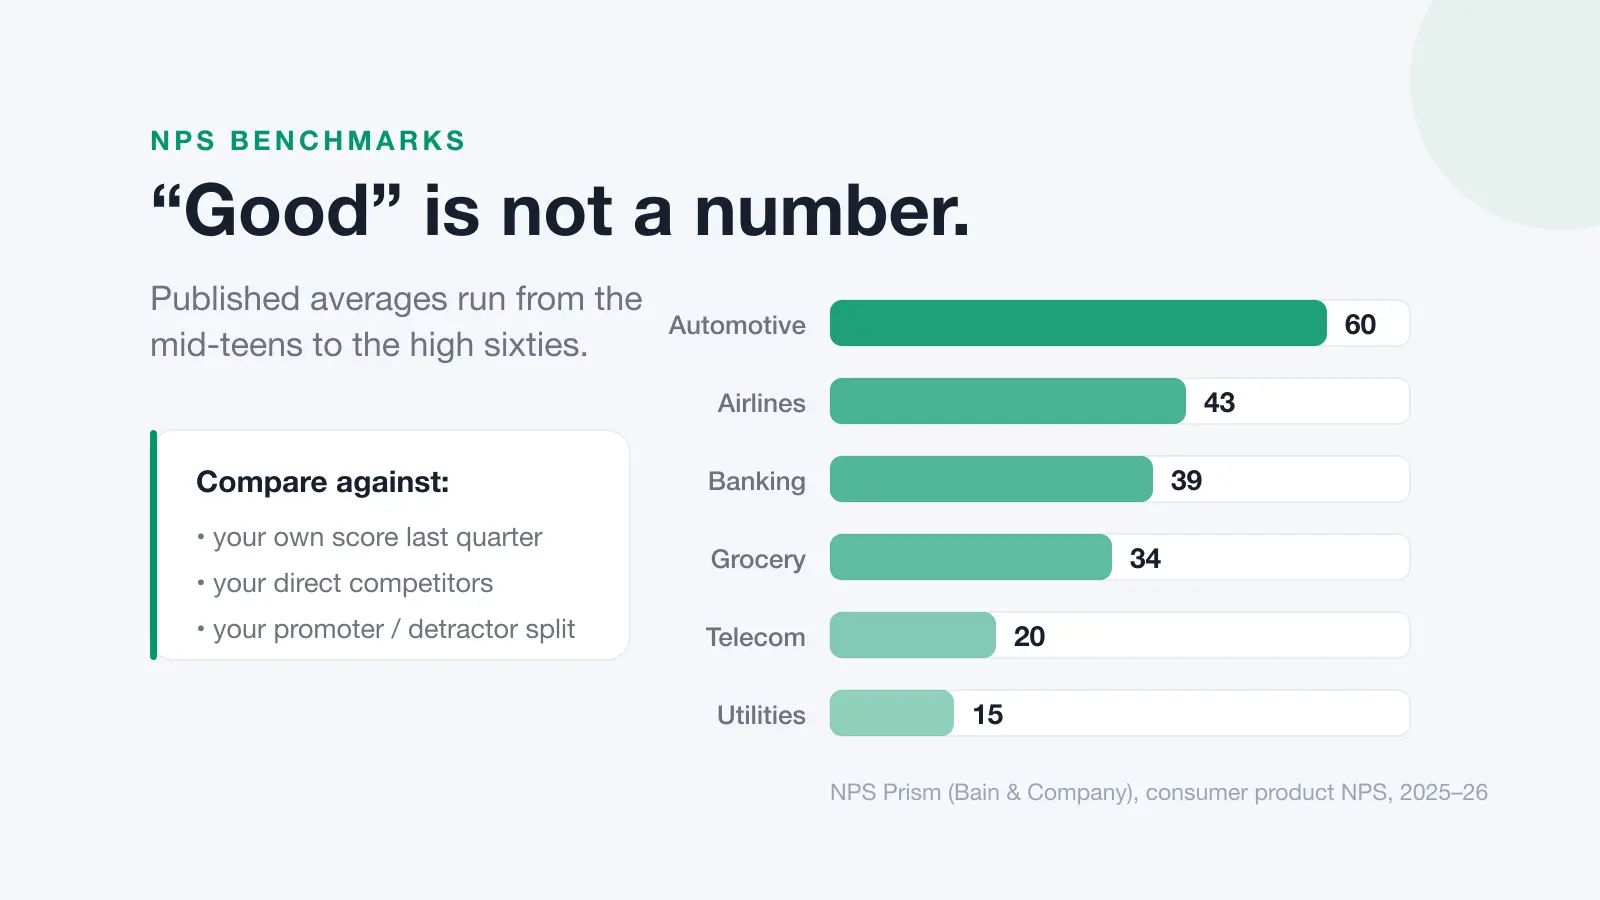
NPS uses a 0-10 scale and a subtraction rather than an average. Promoters score 9-10, passives score 7-8, and detractors score 0-6. Your score is the percentage of promoters minus the percentage of detractors, expressed as a whole number between -100 and +100. Passives count towards your total responses but not towards the score itself.
How to calculate CES
CES asks customers to rate the effort a task required, typically by agreeing or disagreeing with a statement such as "the company made it easy for me to handle my issue" on a 1-7 scale. Most teams report it as the average rating, or as the percentage of respondents choosing the top two options. Either is defensible; consistency is what counts.
CES came out of research published in Harvard Business Review in 2010 by a team at the Corporate Executive Board, who studied more than 75,000 customer interactions and found that reducing effort predicted loyalty better than delighting people did. That finding is specific to service interactions — it's evidence for using CES on your support queue, not for replacing every other metric with it.
The satisfaction data you already have
Surveys are not the only source, and they're the one customers are most tired of. Before adding another one, use what you already collect:
- Your reviews. Public reviews on Google and Facebook are unprompted, specific, and written by customers motivated enough to speak up. They're satisfaction data with the sample bias visible rather than hidden.
- Retention and repeat purchase. Behaviour is a harder currency than opinion. A customer who renews has told you something a survey can't.
- Support ticket volume and reopen rates. A rising reopen rate is a CES problem announcing itself before you've measured anything.
- Complaint themes. Five customers raising the same issue is a signal; a score of 4.2 is not.
Building a programme that lasts
Most satisfaction programmes die of the same three causes. Design against them from the start.
Survey fatigue
Set a contact rule before you launch — a maximum of one survey per customer per period, across every team — and enforce it centrally. Without one, marketing, support and product will each send their own and your response rates will fall for all three.
No route to action
Every low score needs an owner and a deadline. The most valuable thing a satisfaction programme produces isn't the score, it's the follow-up conversation with the customer who gave you a 2. Route detractors to a real person within one business day; that alone recovers more revenue than any dashboard.
Measuring what's easy instead of what matters
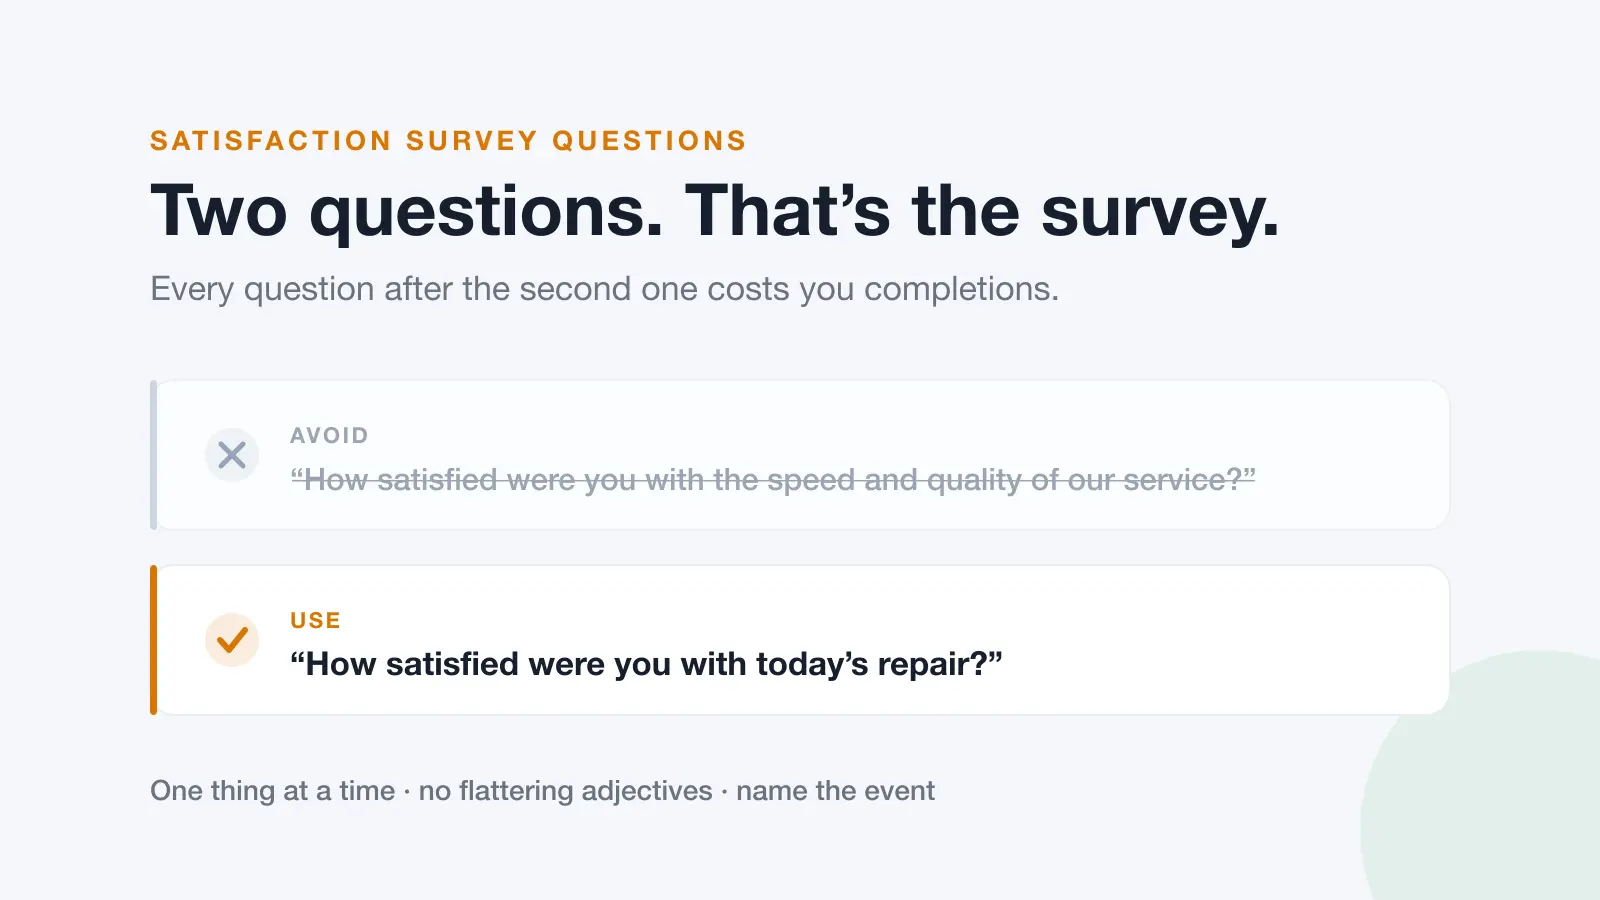
Place your measurement where the customer feels something — after the repair, the delivery, the difficult phone call — not where it's convenient to bolt a survey onto an existing email.
How often to measure
Transactional metrics (CSAT, CES) fire on the event: after the ticket, the delivery, the appointment. Relationship metrics (NPS) run on a cycle — quarterly is enough for most businesses, and monthly is usually more noise than signal unless you have very high volume.
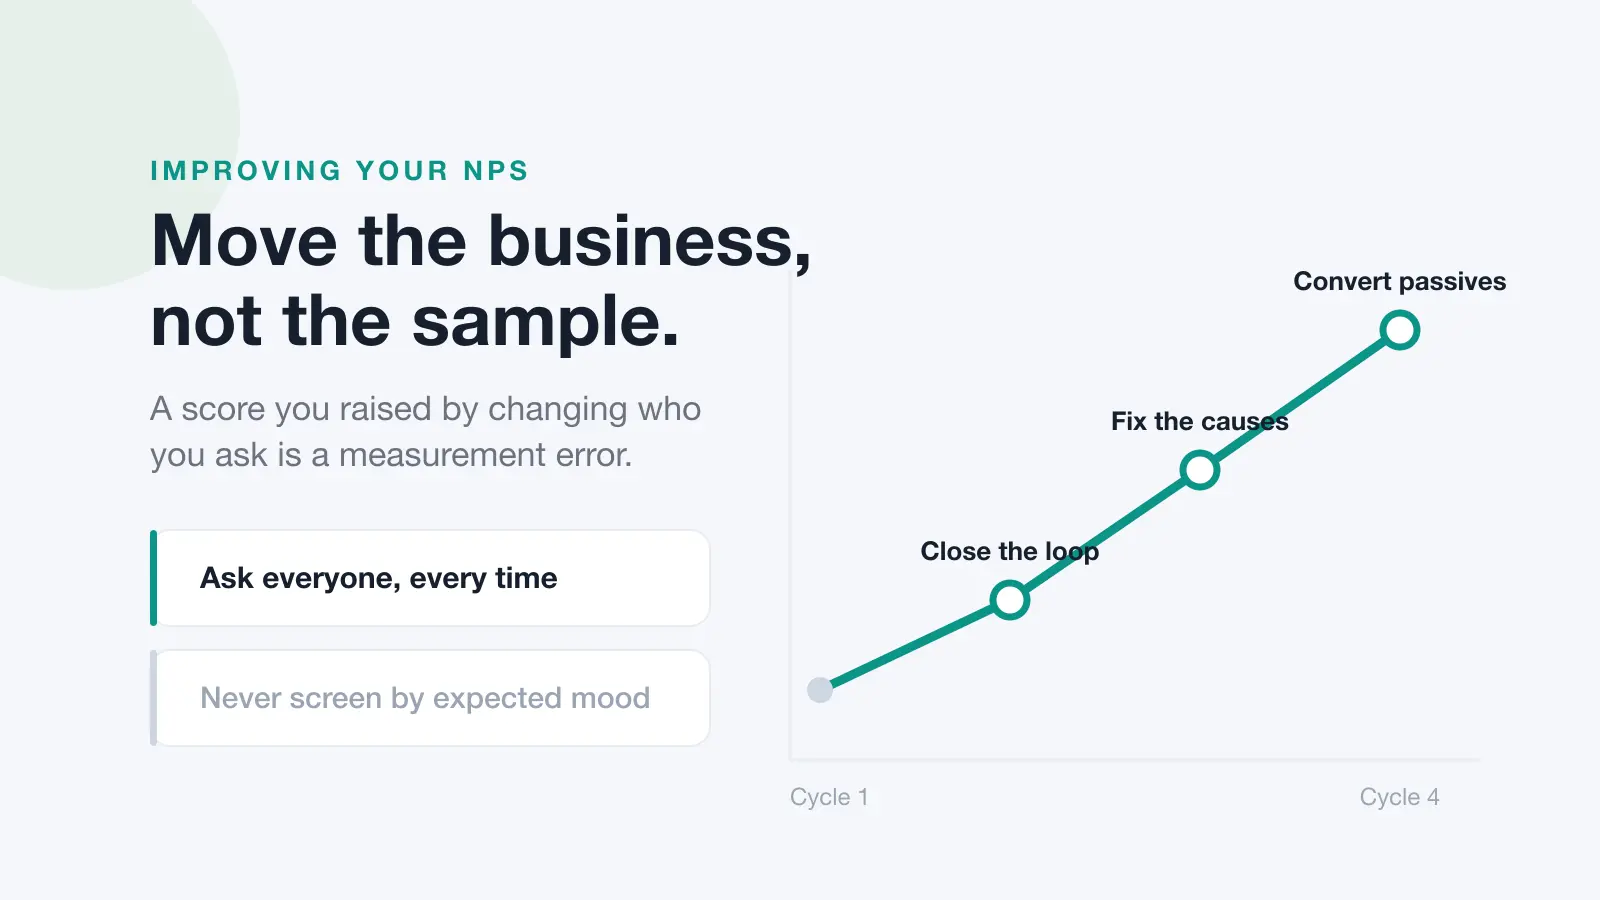
Whatever cadence you choose, hold it steady for at least four cycles before drawing conclusions. Satisfaction scores are noisy at small sample sizes, and the temptation to react to a single bad month has ruined more programmes than bad questions have.
Turning measurement into improvement
A satisfaction programme earns its keep at the point where a number changes a decision. That means each metric needs a named owner, a threshold that triggers action, and a standing slot where the results are reviewed alongside the qualitative feedback.
For most small and mid-sized businesses, the practical version of this is simpler than it sounds: watch your reviews closely, respond to every one, send a short CSAT after the jobs that matter, and check the relationship score quarterly. That's a complete programme, and it fits in an hour a week.
Keeping the review half of that running is what Dinopix Reviews is built for — every review from Google and Facebook in one inbox, sentiment analysed automatically so themes surface without manual tagging, and review requests sent to customers after each job so the feedback keeps coming in.
Frequently Asked Questions
What is the best way to measure customer satisfaction?
There isn't one best method — there's a best method per question. Use CSAT immediately after a specific interaction, CES after a process the customer had to work through, and NPS periodically to track the overall relationship. Combine these with behavioural data you already hold, such as retention and repeat purchase, and with the review text customers write unprompted.
How do you calculate a customer satisfaction score?
CSAT is the number of respondents choosing the top two ratings divided by total respondents, multiplied by 100. On a 1-5 scale that means counting the 4s and 5s. Report it as a percentage rather than an average rating, and keep the scale identical over time — changing the scale breaks comparability with your own history.
How many responses do I need for the score to be meaningful?
Enough that one or two responses can't swing it. As a rough guide, treat scores built on fewer than about 30 responses as directional only, and don't report movement between periods until you have a consistent sample size across both. For small businesses this usually means measuring quarterly rather than monthly.
Can online reviews replace a satisfaction survey?
They can replace a lot of it. Reviews are unprompted, specific and public, which makes them stronger evidence than a survey score for understanding why customers feel as they do. What they don't give you is a controlled, comparable number over time, because who chooses to leave a review varies. Most businesses are best served using reviews for the "why" and a small, consistent survey for the "how much".
How do I stop survey fatigue?
Set a single contact rule across the whole business — one survey per customer per period, no exceptions — and keep surveys to one or two questions. Use passive sources such as reviews, support ticket data and retention figures for everything you don't strictly need to ask about, and never send a follow-up survey to a customer whose last piece of feedback you didn't act on.
Should I measure satisfaction if I only have a handful of customers?
Yes, but skip the scoring. With a small customer base, a scored survey produces a number too noisy to trust while adding a layer of formality between you and people you could simply talk to. Ask them directly, write down what they say, and look for repeated themes. Introduce a metric when you have enough volume that you can no longer hold every conversation yourself.
Sources
This guide draws on the primary sources below. Figures and guidance change — always check the current version.
- Measuring Your Net Promoter Score — Bain & Company, Net Promoter System
- Frederick F. Reichheld, "The One Number You Need to Grow" — Harvard Business Review, December 2003
- Dixon, Freeman & Toman, "Stop Trying to Delight Your Customers" — Harvard Business Review, July-August 2010
- Prohibited & restricted content — Google Business Profile Help