How to Create Automated Client Dashboards with Google Looker Studio and Live Data
Learn how to create automated client dashboards using Google Looker Studio with live data. Master advanced techniques for better reporting.
Picture this: It's 9 AM Monday morning, and instead of scrambling to compile client reports from five different platforms, you're sipping coffee while your clients receive beautifully crafted, real-time dashboards automatically delivered to their inboxes. The data refreshes every hour, the insights are crystal clear, and your phone isn't ringing with "Where's my report?" calls.
This isn't a fantasy—it's the reality for agencies and consultants who've mastered automated client dashboards Google Looker Studio. After building hundreds of these dashboards across industries from e-commerce to SaaS, I've learned that the difference between a good dashboard and a great one isn't just the data—it's the automation that makes it truly valuable to clients.
Why Google Looker Studio is the Ultimate Client Dashboard Platform
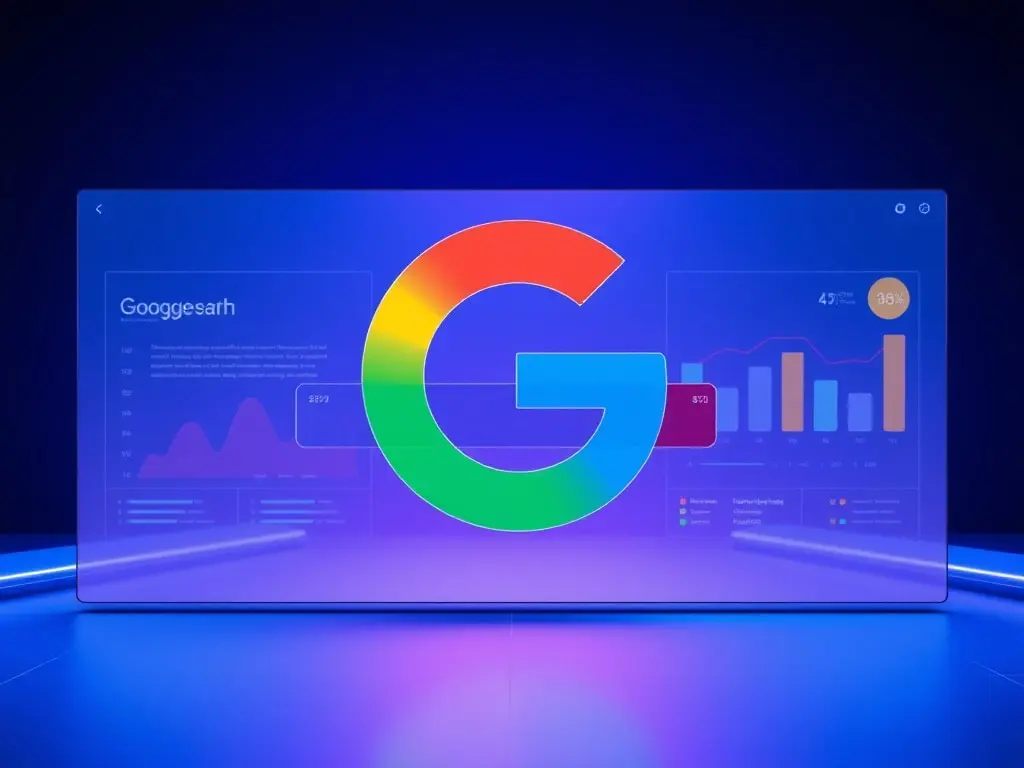
Google Looker Studio has evolved far beyond its humble beginnings as Google Data Studio. The 2025 updates have introduced game-changing features that make it the go-to platform for automated reporting with Looker. Unlike static PDF reports or complex business intelligence tools that require training, Looker Studio creates interactive, web-based dashboards that clients can access anytime, anywhere.
The platform's strength lies in its native integration with Google's ecosystem—GA4, Google Ads, Search Console, and Google Business Profile—combined with over 1,000 third-party connectors. This means you can create unified views that previously required expensive enterprise solutions.
Setting Up Your Data Foundation for Live Automation
Before diving into Google Looker Studio features, you need rock-solid data infrastructure. The biggest mistake I see agencies make is jumping straight to visualization without proper data planning.
Essential Data Sources to Connect
- Google Analytics 4: Your primary behavioral and conversion data
- Google Ads: Paid search performance and attribution
- Google Search Console: Organic search visibility and technical SEO insights
- Facebook/Meta Ads: Social media advertising performance
- Google Sheets: Custom calculations, goals, and offline data
- CRM Systems: Sales pipeline and customer lifecycle data
Data Blending Strategy
The magic of live data dashboards happens through strategic data blending. Instead of showing isolated metrics from each platform, blend data sources to create meaningful insights. For example, combine GA4 session data with Google Ads cost data to calculate true ROAS, or blend Search Console impressions with GA4 organic sessions to identify content gaps.
Here's my proven approach for data blending:
- Identify common dimensions (date, campaign name, source/medium)
- Standardize naming conventions across platforms
- Create calculated fields for custom metrics
- Test data accuracy with known benchmarks
Building Your First Automated Client Dashboard
Now comes the exciting part—actually building your real-time data analytics dashboard. I'll walk you through my battle-tested process that's created dashboards for clients ranging from local businesses to Fortune 500 companies.
Dashboard Architecture Planning
Start with structure, not visuals. Every successful client dashboard follows this hierarchy:
- Executive Summary Page: High-level KPIs and trends
- Acquisition Analysis: Traffic sources and channel performance
- Conversion Tracking: Goals, events, and revenue attribution
- Campaign Deep-Dives: Platform-specific performance details
Implementing Responsive Layouts
Google Looker Studio's 2025 responsive layout feature is a game-changer for client accessibility. Unlike the old freeform canvas, responsive layouts automatically adapt to mobile and desktop screens. This is crucial because 60% of clients will view your dashboards on mobile devices.
Creating Interactive Elements
Static dashboards are dead. Clients expect interactivity that lets them explore their data. Here are the interactive elements I include in every dashboard:
- Date Range Controls: Let clients compare different time periods
- Campaign/Channel Filters: Enable focused analysis on specific initiatives
- Geographic Filters: Essential for multi-location businesses
- Drill-Down Tables: Summary charts with detailed breakdowns below
Advanced Automation Techniques
Here's where most tutorials stop, but this is where the real value begins. Google Looker Studio tutorial content rarely covers advanced automation that transforms dashboards from reporting tools into business intelligence platforms.
Automated Alert Systems
While Looker Studio doesn't have native alerting, you can create sophisticated alert systems using Google Sheets functions combined with Google Apps Script. Set up automated emails when:
- Conversion rates drop below thresholds
- Campaign costs exceed budgets
- Website traffic spikes or crashes
- Goal completions hit monthly targets
Dynamic Content Based on Performance
Use calculated fields and conditional formatting to create dashboards that adapt to performance. For example, automatically highlight underperforming campaigns in red, or show different messaging when goals are exceeded versus missed.
Client Dashboard Examples That Drive Results
Let me share three client dashboard examples that consistently deliver value:
E-commerce Performance Dashboard
Focuses on revenue attribution across channels, product performance, and customer journey analysis. Key metrics include ROAS by campaign, product conversion rates, and customer lifetime value trends.
Lead Generation Dashboard
Emphasizes cost-per-lead, lead quality scores, and sales conversion rates. Includes lead source analysis, form completion rates, and pipeline velocity metrics.
Content Marketing Dashboard
Tracks content performance across organic search, social media, and email. Features include page engagement metrics, content conversion paths, and SEO performance indicators.
Looker Studio Best Practices for Professional Dashboards
After years of refinement, these Looker Studio best practices separate amateur dashboards from professional-grade reporting:
- Consistent Color Schemes: Use brand colors and maintain visual hierarchy
- Clear Chart Labeling: Every metric should be immediately understandable
- Performance Optimization: Limit data ranges and use extracts for large datasets
- White Space Management: Avoid cluttered layouts that overwhelm clients
- Mobile-First Design: Test every dashboard on smartphone screens
Troubleshooting Common Automation Issues
Even with perfect setup, automation issues arise. Here are the most common problems and solutions:
Data Refresh Delays
Google connectors typically refresh every 15 minutes to 24 hours depending on the data source. For critical real-time monitoring, use Google Analytics Intelligence API or third-party tools like Supermetrics for faster refresh rates.
Attribution Discrepancies
Different platforms use different attribution models. Document these differences clearly in your dashboard notes, and consider creating unified attribution models using Google Analytics 4's data-driven attribution as your baseline.
The Future of Automated Client Reporting
Looking ahead, data visualization tools like Google Looker Studio are incorporating AI-powered insights and predictive analytics. The 2025 roadmap includes natural language querying and automated anomaly detection—features that will make dashboards even more valuable to clients.
The agencies that succeed will be those who master not just the technical aspects of visualizing live data, but also the strategic thinking that turns data into actionable business intelligence.
Start building your automated client dashboards today. Your clients will love the transparency and insights, and you'll love the time savings and professional credibility that comes with delivering consistently excellent reporting.
Frequently Asked Questions
How often does data refresh in Google Looker Studio dashboards?
Data refresh frequency depends on the connector. Google Analytics 4 typically refreshes every 15-30 minutes, Google Ads updates hourly, and Google Sheets refresh every 15 minutes. Third-party connectors may have different refresh schedules, ranging from 15 minutes to 24 hours.
Can I automate dashboard delivery to clients via email?
While Looker Studio has limited email automation (maximum 50 recipients), you can use Google Apps Script to create more sophisticated delivery systems. Many agencies use shared links or embed dashboards in client portals for better access control.
What's the cost of creating automated client dashboards in Google Looker Studio?
Google Looker Studio is completely free for standard use. Costs may arise from premium data connectors (like Supermetrics at $99+/month) or third-party automation tools. Most agencies can create sophisticated dashboards using only free Google connectors.
How do I handle data discrepancies between different platforms?
Data discrepancies are normal due to different tracking methods and attribution models. Create clear documentation explaining these differences, use consistent date ranges, and establish one platform (typically GA4) as your "source of truth" for unified metrics.
Can I create white-label dashboards for my agency clients?
Yes, Google Looker Studio supports full customization including logos, colors, and branding. You can remove Google branding and create completely white-labeled dashboards that appear as your agency's proprietary reporting solution.
What's the maximum amount of data Google Looker Studio can handle?
Looker Studio can handle up to 100MB per data source and 1GB total per dashboard. For larger datasets, use data extracts, sampling, or aggregate data in Google Sheets before connecting to maintain optimal performance.