What Is a Good NPS Score? Benchmarks by Industry

What counts as a good NPS score, real industry benchmarks from Bain and Retently, why the two disagree by 30 points, and what to measure against instead.
Ask what counts as a good NPS score and you'll be told 30 is good, 50 is great and 70 is world-class. Those numbers circulate everywhere and are usually attributed to Bain & Company, who own the Net Promoter trademark. Bain's own published guidance doesn't state them.
What Bain does say is more useful and less quotable: scores run from -100 to +100, higher is better, and performance depends heavily on context — industry, country, business model, and how you collected the responses. In their words, good looks different for every organisation.
So here's the honest version: real benchmark data from two sources, what it shows, why the two disagree with each other, and what to do instead of chasing a number.
Why the famous thresholds are shakier than they look
The 30/50/70 rule of thumb is repeated so often it has acquired the appearance of a standard. Treat it carefully for three reasons.
It ignores industry. An NPS of 25 is poor for a car dealership and strong for a broadband provider. Applying one threshold across both is like judging every athlete by the same 100-metre time.
It ignores methodology. Scores shift with how you ask. Transactional surveys sent straight after a good experience run higher than relationship surveys sent quarterly. Chasing non-responders raises your response rate and usually lowers your score, because the enthusiastic answer first.
It ignores country. Cultural response styles differ enough to move a score meaningfully. Respondents in some markets use the top of a scale freely; in others a 7 is genuine praise. A multi-country average conceals this entirely.
NPS benchmarks by industry
Two published datasets are worth knowing. They use different methods and produce noticeably different numbers, which is itself the most instructive thing about them.
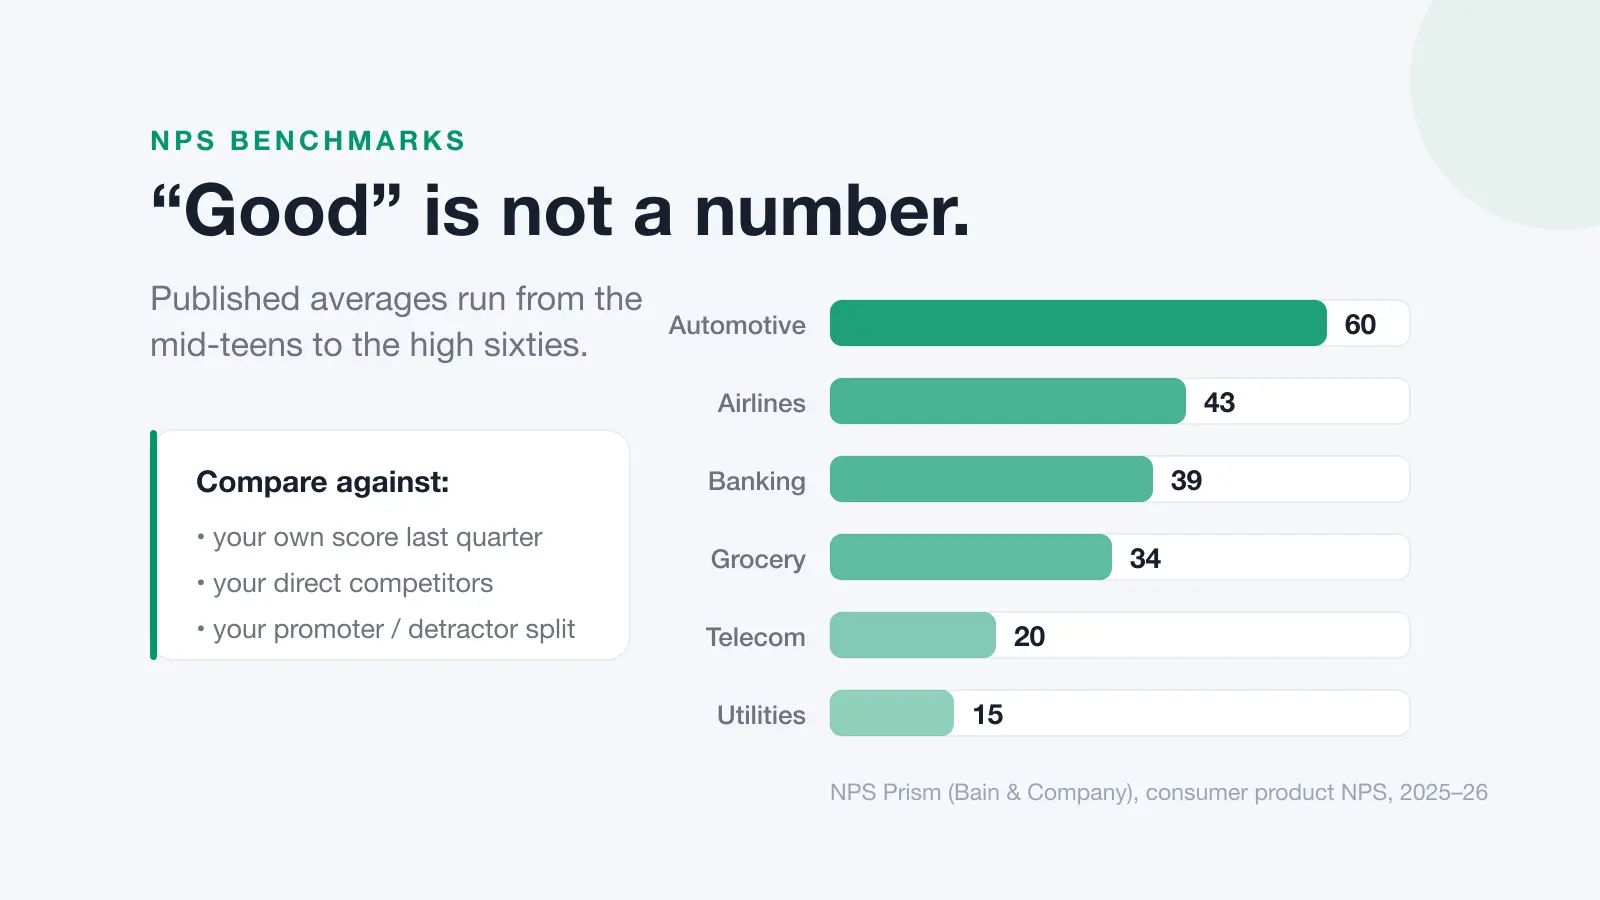
NPS Prism (Bain & Company), 2025-26
Bain's benchmarking product publishes consumer-facing product NPS figures:
| Sector | NPS |
|---|---|
| Automotive | 60 |
| Airlines | 43 |
| Consumer banking — payments | 42 |
| Consumer banking — wealth management | 40 |
| Consumer banking — checking & savings | 39 |
| Insurance — life | 38 |
| Consumer banking — credit cards | 35 |
| Grocery | 34 |
| Insurance — property & casualty | 32 |
| Telecom — wireless | 20 |
| Telecom — streaming | 17 |
| Telecom — internet | 16 |
| Utilities | 15 |
Retently's 2026 benchmark report
Retently publishes averages drawn from their own customer base, limited to industries with more than ten clients and a sample of at least 10,000 surveys, not segmented by company size or country:
| Sector | NPS |
|---|---|
| Financial services (B2B) | 68 |
| Consulting | 68 |
| Technology & services | 63 |
| Ecommerce & retail (B2B) | 61 |
| Digital marketing agencies | 49 |
| Property management | 47 |
| Insurance (B2B) | 46 |
| Logistics & transportation | 42 |
| Construction | 42 |
| B2B software & SaaS | 41 |
| Communication & media | 39 |
| Internet software & services (B2C) | 26 |
What actually counts as good
Four comparisons are worth more than any published average.
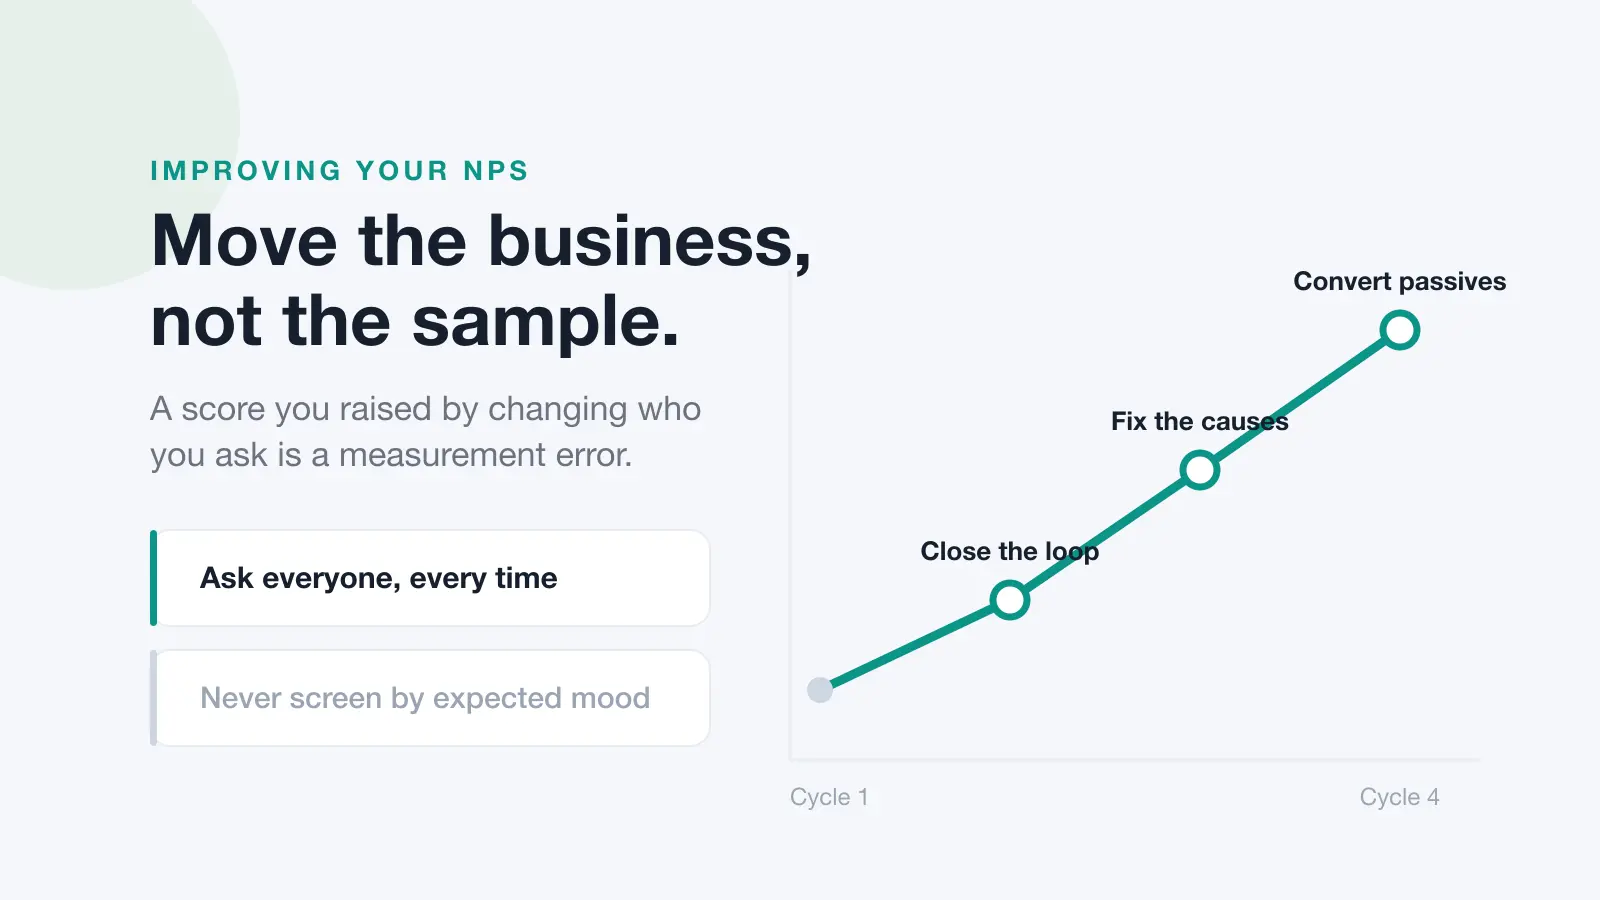
Your own trend. Same question, same scale, same audience, same timing — measured over at least four cycles. A score of 22 rising steadily from 8 is a healthier business than a 45 that was 60 last year.
Your distribution, not your headline. Because passives (7s and 8s) are excluded from the calculation, two businesses with identical scores can be in very different positions. A 30 built from 45% promoters and 15% detractors is fragile. A 30 built from 35% promoters and 5% detractors, with a large passive middle, is a much safer base. Always publish the split alongside the number.
Your direct competitors, measured the same way. Not a sector average — the two or three businesses your customers actually chose between. This is hard to get, which is why it's valuable.
Whether the score moves when you fix things. If you resolve a known problem and your NPS doesn't respond over two cycles, your survey isn't reaching the affected customers. That's a measurement problem worth more attention than the number itself.
Small businesses and small samples
If you're collecting 30 or 40 responses a quarter, your NPS is dominated by noise. It's a difference between two percentages, so a handful of people changing their minds moves the headline several points — and you'll spend meetings explaining variance that means nothing.
At that volume, the honest approach is to read the responses rather than score them, and to lean on sources that don't depend on survey participation: repeat business, retention, and the reviews customers write unprompted. Introduce the score when your volume makes it stable.
Raising the score honestly
The reliable levers are unglamorous: close the loop with every detractor within a business day, fix the causes that repeat rather than the individual complaints, and make sure your promoters are actually asked to say so publicly. Most businesses have far more goodwill than reviews, simply because nobody asks.
That last part is what Dinopix Reviews automates — review requests after each job, every Google and Facebook review in one inbox, and AI-drafted replies so closing the loop with an unhappy customer takes minutes. For the detail on wording your survey so it produces usable answers, see the exact NPS question; for choosing between NPS, CSAT and CES in the first place, see our head-to-head comparison.
Frequently Asked Questions
What is a good NPS score?
There is no universal threshold. Published industry averages range from around 15 for utilities to about 68 for B2B consulting, and two reputable datasets can differ by 30 points for the same sector because they use different methods. Any score above zero means you have more promoters than detractors; beyond that, judge yourself against your own trend and your direct competitors rather than a published average.
Is 30 a good NPS score?
It depends entirely on your sector and how you collected it. Thirty would be strong for a broadband or utility provider, where published averages sit in the mid-teens, and weak for automotive, where Bain's benchmarking puts the average around 60. The widely repeated "30 is good, 50 is great, 70 is world-class" scale is a rule of thumb rather than published Bain guidance.
What is the highest possible NPS score?
+100, which would mean every single respondent scored you 9 or 10 with no detractors at all. The lowest possible is -100. In practice scores above about 70 are rare and usually indicate either a small, self-selected sample or a niche business with unusually devoted customers.
Why do NPS benchmarks differ so much between sources?
Because the underlying samples and methods differ. Providers publish averages from their own customer bases, which vary in company size, country and industry mix, and transactional surveys sent immediately after a positive experience produce higher scores than periodic relationship surveys. Response rates matter too — chasing non-responders typically lowers a score, because enthusiastic customers answer first.
Should I set an NPS target for my team?
Set a target for the trend, not for an absolute number, and never tie it directly to individual pay. Absolute targets borrowed from benchmark tables encourage the wrong behaviours — surveying selectively, timing sends around good experiences, or pressing customers for a specific rating. Targeting sustained improvement in your own score, alongside response volume, avoids most of that.
How is NPS calculated?
Ask "how likely are you to recommend us to a friend or colleague?" on a 0-10 scale. Promoters score 9-10, passives 7-8, and detractors 0-6. Your NPS is the percentage of promoters minus the percentage of detractors, expressed as a whole number between -100 and +100. Passives count towards your total responses but do not affect the score.
Sources
This guide draws on the sources below. Benchmark figures are updated periodically — always check the current version before quoting them.