NPS vs CSAT vs CES: Which Metric Should You Actually Track?

NPS, CSAT and CES compared head-to-head: what each predicts, what the research actually says, where each fails, and which to run if you only run one.
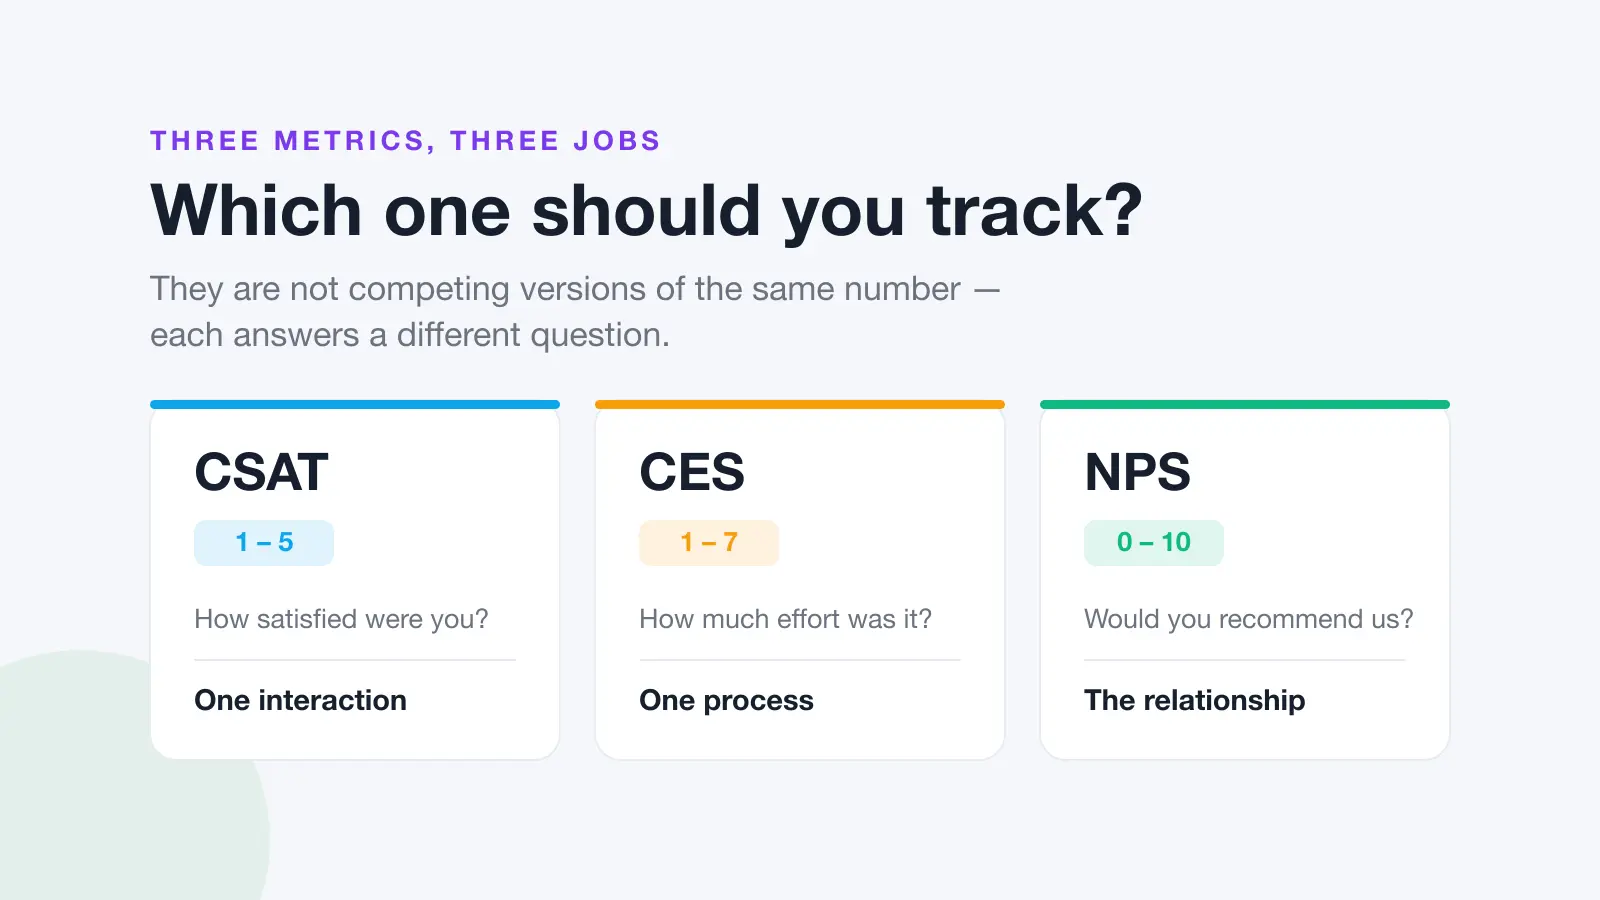
NPS, CSAT and CES all claim to measure how customers feel, and vendors selling each one will tell you theirs is the one that predicts loyalty. They're measuring genuinely different things, and the difference isn't academic. Pick the wrong one and you'll spend a year optimising a number that has no relationship to the problem you actually have.
This is the head-to-head: what each metric asks, what the evidence says it predicts, where each one fails, and which to choose if you're only going to run one.
The three metrics at a glance
| CSAT | CES | NPS | |
|---|---|---|---|
| Asks | How satisfied were you with this? | How much effort did you have to put in? | How likely are you to recommend us? |
| Scale | 1-5 (commonly) | 1-7 (commonly) | 0-10 |
| Reported as | % choosing the top two | Average, or % choosing the top two | % promoters − % detractors (−100 to +100) |
| Scope | One interaction | One process or task | The whole relationship |
| Timing | Straight after the event | Straight after the task | Periodic, or after a milestone |
| Best at | Spotting bad interactions fast | Finding friction to remove | Tracking the relationship over time |
| Worst at | Predicting long-term loyalty | Anything outside a process | Telling you what to fix |
CSAT: did this specific thing go well?
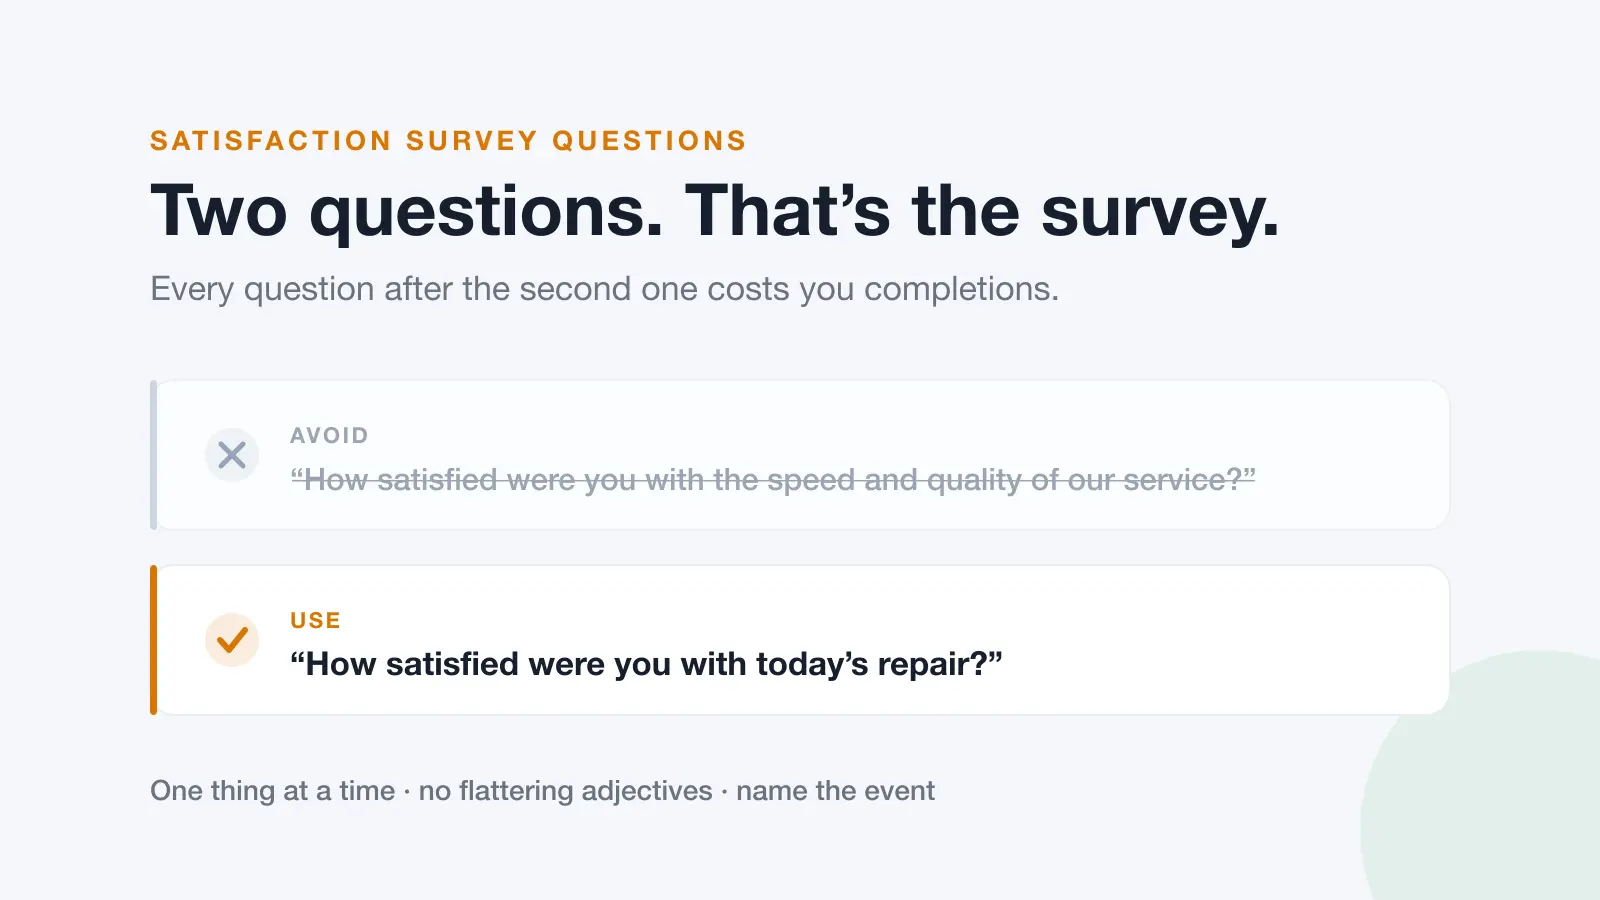
CSAT is the most direct of the three. You ask how satisfied someone was with a defined thing, a repair, a delivery, a phone call, and report the percentage who chose the top two ratings.
Its strength is precision and speed. Because it's tied to one event, a low CSAT points at something specific: this technician, this route, this Tuesday. You can act on it the same week. It's also the easiest for customers to answer, which shows up in completion rates.
Its weakness is that satisfaction is a low bar. Customers routinely report being satisfied right up until they leave, because "satisfied" describes the absence of a problem rather than the presence of a reason to stay. A high CSAT tells you that you're not annoying people. It doesn't tell you they'd choose you again.
CES: how hard did they have to work?
CES asks customers to rate the effort a task required, usually by agreeing or disagreeing with a statement like "the company made it easy for me to handle my issue".
It has the strongest research behind it in one specific setting. A team at the Corporate Executive Board studied more than 75,000 customer interactions and published the results in Harvard Business Review in 2010 under the title "Stop Trying to Delight Your Customers". They compared CSAT, NPS and their new effort measure, and found effort was the better predictor of loyalty in service interactions, delighting customers didn't build loyalty nearly as reliably as removing friction reduced disloyalty.
CES also has a practical weakness: there is no single standard version. Scale lengths and question wording vary between vendors, so a CES of 5.2 is not comparable with anyone else's. Treat it as an internal diagnostic, not a benchmark.
NPS: how strong is the relationship?
NPS asks how likely a customer is to recommend you, on a 0-10 scale, and subtracts the percentage of detractors (0-6) from the percentage of promoters (9-10). It came out of Frederick Reichheld's 2003 Harvard Business Review article arguing that a single recommendation question predicted growth better than the long satisfaction surveys of the time.
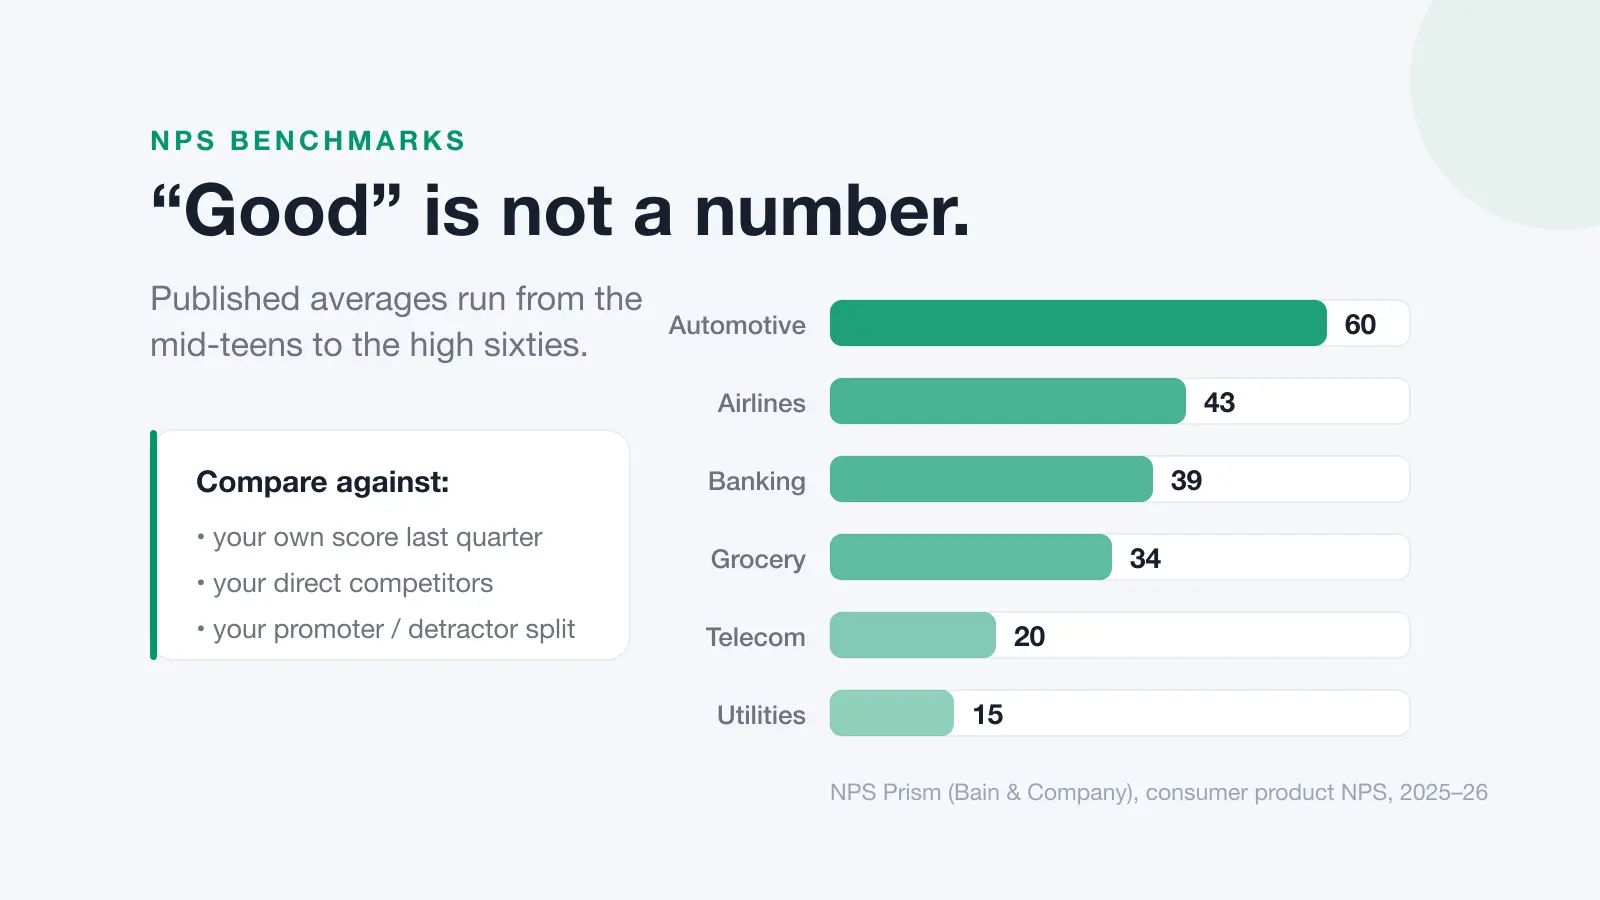
Its real strength is that everyone knows it. It's the only one of the three with widely published industry benchmarks, and it's the metric a board or an investor will ask for by name. As a periodic measure of whether the relationship is getting better or worse, it does its job.
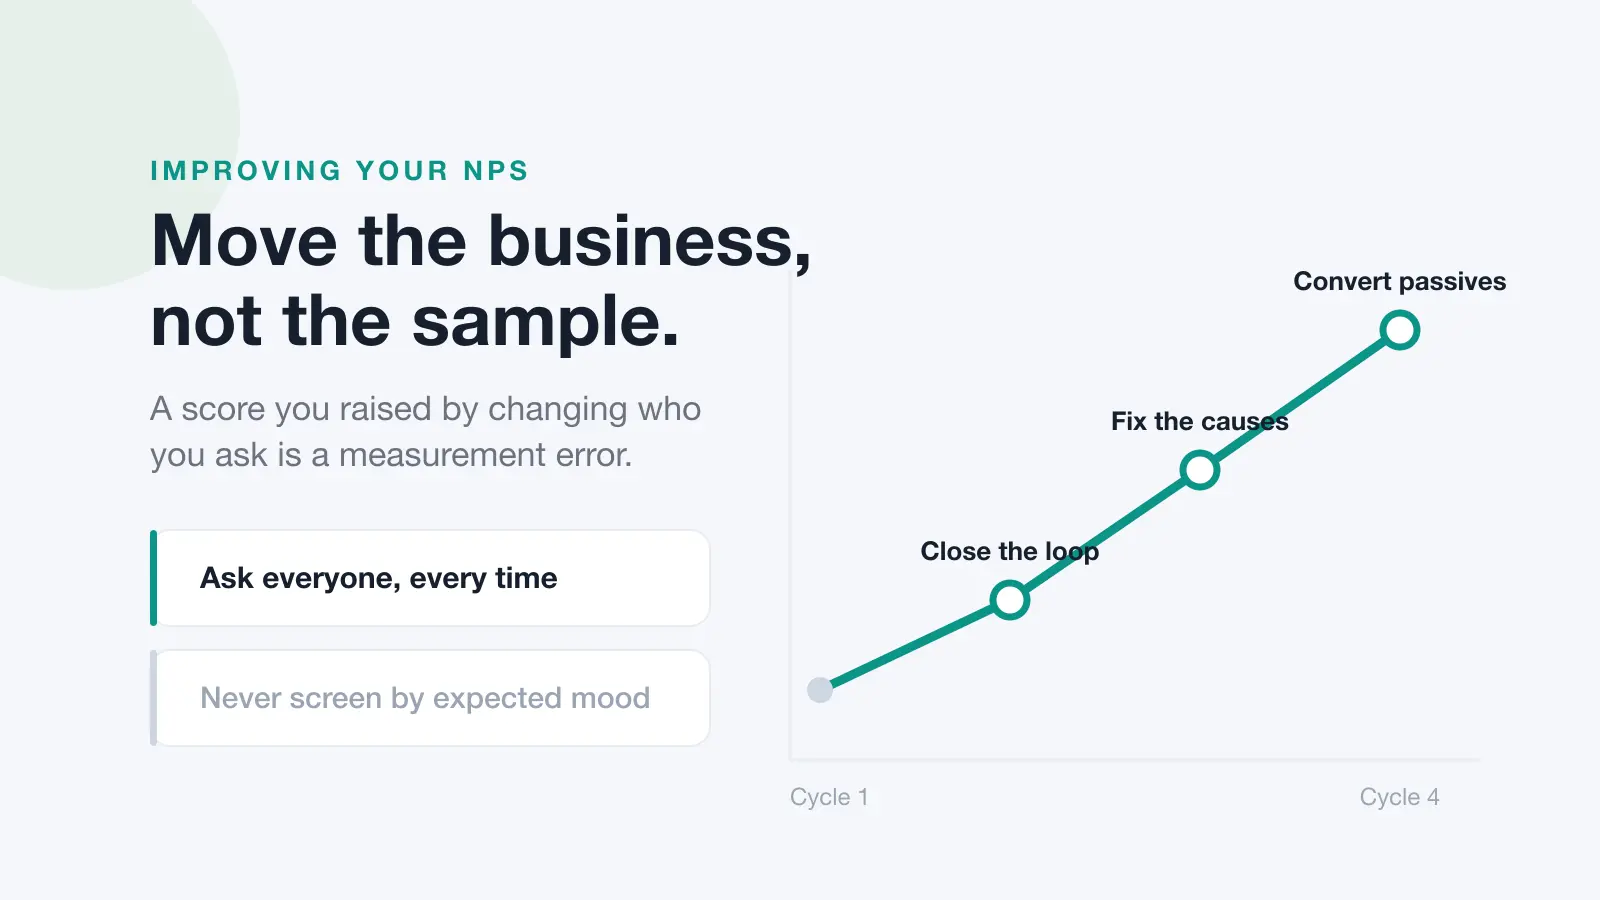
Its weaknesses are structural. Passives, the 7s and 8s, are excluded from the calculation entirely, so a genuine improvement from a 3 to a 6 shows up as no change at all. The score is also noisy at small sample sizes: with 40 responses, two people changing their mind moves your headline number by five points. And because it asks about the relationship in general, a bad score tells you something is wrong without giving you the faintest idea what.
Which should you actually track?
Match the metric to the decision, not to what sounds most sophisticated.
- You want to catch bad jobs before customers churn quietly. CSAT, fired after every job. It's specific, fast, and easy to answer.
- Your support queue or returns process is the problem. CES, on that process only. This is the setting the research actually covers.
- You need a number to track quarterly and report upwards. NPS, with the follow-up question, run on a fixed cadence.
- You have fewer than about 30 responses a quarter. None of them. Read what customers write, talk to them directly, and introduce a metric when you have the volume to make it stable.
What all three miss
Every one of these metrics shares the same blind spot: they only hear from people who answer surveys. That group skews towards the delighted and the furious, and away from the quietly disappointed majority who simply don't come back.
Two sources fill the gap, and you already have both. Behaviour, retention, repeat purchase, reopen rates, is harder evidence than any stated intention, because it costs the customer something. And public reviews are unprompted, specific and written for other customers rather than for you, which makes them considerably more candid than a survey response.
If you want the full picture of how to combine survey scores with the data you already hold, we've covered building the programme in how to measure customer satisfaction.
Keeping the review side of that running is what Dinopix Reviews does, Google and Facebook reviews in one inbox, sentiment analysed so themes surface without manual tagging, and requests sent automatically after each job so you're hearing from more than just the extremes.
Frequently Asked Questions
What is the difference between NPS and CSAT?
CSAT measures satisfaction with one specific interaction and is reported as the percentage of respondents choosing the top two ratings. NPS measures likelihood to recommend the business overall and is reported as the percentage of promoters minus the percentage of detractors, on a scale from -100 to +100. CSAT is a snapshot of an event; NPS is a read on the relationship.
Is CES better than NPS?
For customer service interactions, the research suggests yes. The 2010 Harvard Business Review study of more than 75,000 interactions found effort predicted loyalty better than satisfaction or recommendation scores in that setting. Outside service interactions that finding doesn't transfer, and CES has no standard version or published benchmarks, so it works as an internal diagnostic rather than a comparable headline metric.
Can I use NPS and CSAT together?
Yes, and it's a common pairing: CSAT after each interaction for operational feedback, NPS quarterly for the relationship trend. The requirement is a single contact rule across the business so customers aren't receiving both in the same week, and a named owner for each score. Running two metrics that nobody acts on is worse than running one that someone does.
Which metric best predicts customer loyalty?
It depends on the context, which is why the question has no settled answer. CES has the strongest evidence within service interactions. NPS was designed as a growth predictor and correlates with it at company level. CSAT is the weakest predictor of long-term loyalty, because customers frequently report satisfaction shortly before leaving. Behavioural data such as retention and repeat purchase outperforms all three.
How many responses do I need for these scores to be reliable?
Treat any score built on fewer than about 30 responses as directional only. NPS is the most sensitive of the three to small samples because it's a difference between two percentages, with 40 responses, two people changing their answer can move the headline by around five points. Report the response count next to the score every time.
Do I need a survey metric at all if I collect reviews?
Not necessarily. Reviews are unprompted, detailed and public, which makes them stronger evidence about why customers feel as they do. What they don't provide is a controlled, comparable number over time, because who chooses to leave a review varies month to month. Many small businesses are well served using reviews for the "why" and one short survey metric for the "how much".
Sources
This guide draws on the primary sources below. Research and definitions change. Always check the current version.